How Much More Do DSOs Pay Than Private Buyers for the Same Dental Practice?
Data Brief
- Published
- May 9, 2026
- Edition
- PPR-DB-2026-V1
- Publisher
- Private Practice Research
- Plain text mirror
- /dso-vs-private-buyer-premium.txt
Suggested citation
Private Practice Research. (2026). How Much More Do DSOs Pay Than Private Buyers for the Same Dental Practice? (Report No. PPR-DB-2026-V1). Private Practice Research. https://privatepracticeresearch.org/reports/dso-vs-private-buyer-premium
Edition: PPR-DB-2026-V1 Status: DRAFT (pre-publish, awaiting operator review) Prepared by: Private Practice Research Editorial Staff. Data Desk. Published: 2026-05-09 Last Updated: 2026-05-01
PPR Methodology Callout This Data Brief synthesizes broker-published transaction multiples and DSO acquisition disclosures to quantify the premium that dental support organizations pay over private (individual-buyer) transactions. Sources include FOCUS Investment Banking, TUSK Practice Sales, McLerran & Associates broker reports, and ADA Health Policy Institute aggregate data on practice ownership. Where multiples are reported as ranges, midpoints are used for comparison and the underlying range is disclosed in-line. This article does not represent a valuation, does not constitute legal or tax advice, and is not affiliated with any DSO or transition broker. Authorship: Private Practice Research editorial staff.
Executive Summary#
Private Practice Research finds that dental support organizations (DSOs) pay roughly 30 to 50 percent more than individual private buyers for the same dollar of earnings, with DSO-eligible transactions clearing 7 to 12 times EBITDA versus 4.5 to 7 times for solo-GP private deals [1][2]. The premium is real but conditional, not universal.
The 30 to 50 percent average hides a tiered market. Solo general practices sold to individual dentist-buyers cluster around 4.5 to 5.5 times EBITDA, capped by what one dentist can finance through a bank. Platform-fit practices acquired by DSOs clear higher multiples because the buyer is committed private equity capital, not a single working dentist.
Practice size, owner-dependence, geography, and clinical mix all gate access to the higher band. DSO multiples represent one path within the broader valuation model PPR has documented, not a universal benchmark. For the full taxonomy, see the four-path transition framework.
How Big Is the DSO Premium?#
The numerical answer breaks into three tiers, drawn from broker aggregate data covering completed 2024 to 2026 transactions [1][2][3].
- Solo GP, individual private buyer: 4.5 to 5.5 times EBITDA.
- DSO-eligible mid-size group: 6 to 7 times EBITDA, with platform-fit candidates reaching 7.5 to 8 times.
- Large multi-location DSO acquisitions: 7.5 to 9 times EBITDA at the deal level, with platform-level deals (where one investor sells the whole DSO to the next investor) and strategic combinations reaching 10 to 12 times [1][5].
For the same dollar of EBITDA, the DSO premium over a private-comparable offer runs 30 percent at the low end and over 50 percent where strategic fit is strong. The dollar premium grows with practice size, because the same multiple gap applied to a larger earnings base produces a wider absolute spread.
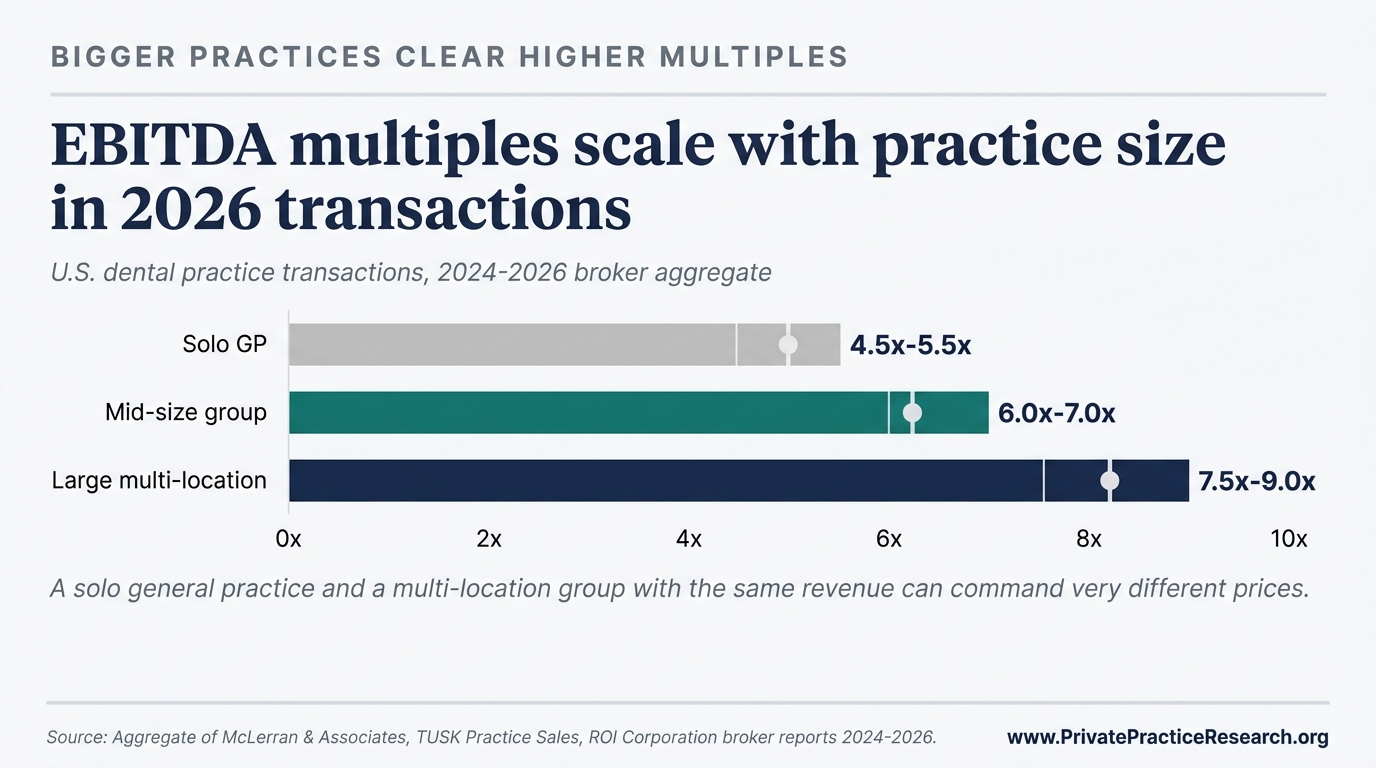
The chart above, from §3.1 of the State of Private Practice 2026 Q2 Report, shows multiples by practice tier. The gap between tiers is built into the buyer's economics, not the seller's negotiating position [5].
Why Do DSOs Pay More?#
Three things drive the spread, and none of them require the DSO buyer to be overpaying.
Where the money comes from. A private-equity-backed DSO is spending fund money it has already raised, with five to ten years before investors expect it back. That patience lets the DSO pay more today and wait longer to recoup. An individual dentist buying with a bank loan is constrained by what the bank will lend against personal income and what the practice's monthly cash flow can cover after the loan payment. That puts a hard ceiling on the multiple any individual buyer can offer [1].
Why DSOs are willing to pay more. The DSO's plan is straightforward arithmetic. Buy ten practices at seven times EBITDA each. Combine them into one larger group that, because of its size, sells at ten times EBITDA when the next investor buys the whole platform a few years later. The three-times difference between purchase and resale price is the entire reason DSOs exist, and DSOs share a piece of that future gain with sellers at entry. That's why DSO offers run higher than what a private dentist-buyer can finance [2].
Why some practices fit and others don't. DSOs pay extra for practices that fill out an existing platform: same metro area, similar payer mix, additional patient volume the platform can absorb. Two practices with identical earnings can clear different multiples depending on whether the buyer already owns three nearby. TUSK's 2025-2026 review calls this fit premium [2].
When Does the DSO Premium Disappear?#
The premium is conditional. Four things make it disappear.
- Practices below roughly $1.2M in collections fall under the platform threshold; most institutional DSO buyers will not underwrite them at all [1].
- Heavily owner-dependent practices, where single-provider production exceeds 90 percent of total, trigger a documented 10 to 20 percent haircut even from DSO buyers [1].
- Rural and non-MSA locations face structural exclusion. DSOs concentrate acquisitions in metropolitan statistical areas above 100,000 population [4][5].
- Specialty practices that fall outside the buyer's existing clinical mix do not receive the platform-fit premium and often default to private-comparable pricing.
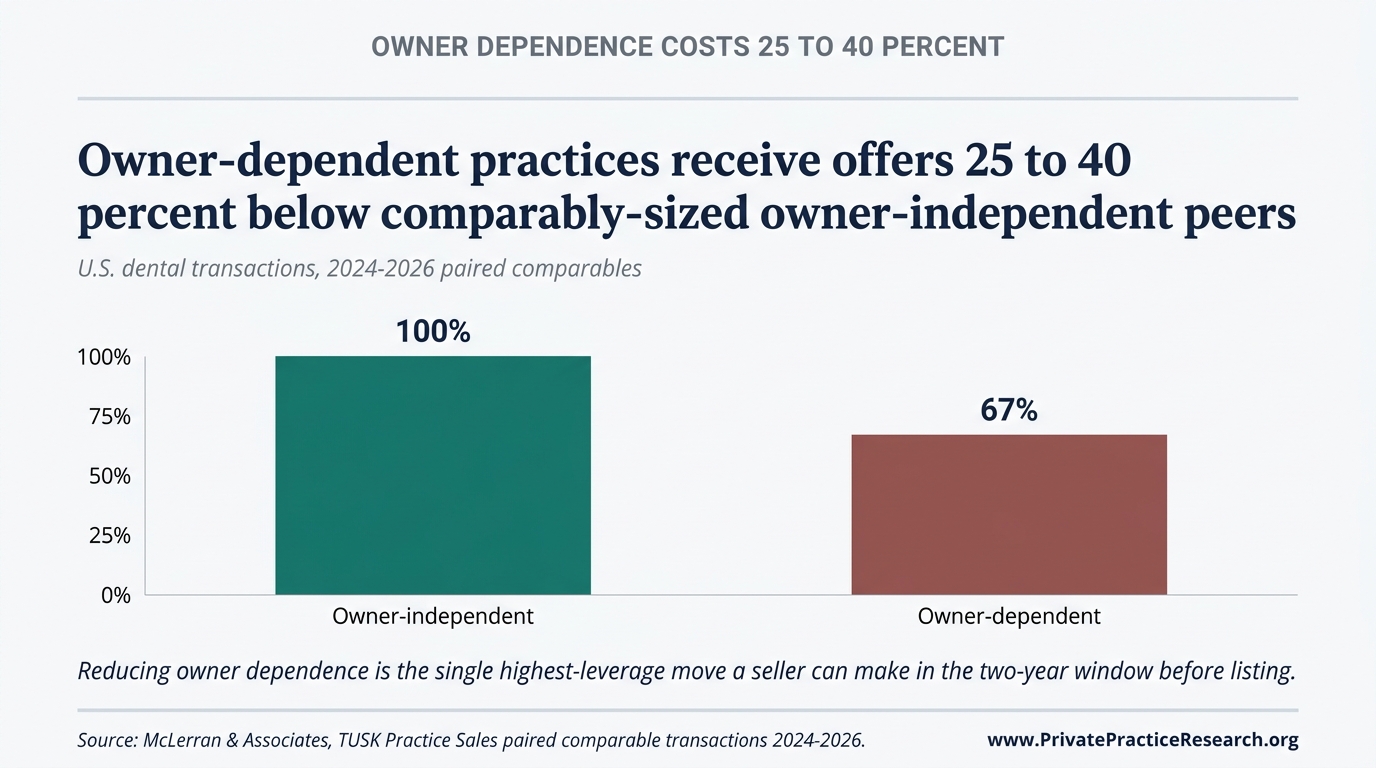
The State of Private Practice 2026 Q2 Report documents the owner-dependence effect in §7 Consensus 3 and the metro-rural geographic concentration in §5.2 [5].
What This Means for Practice Owners Approaching Transition#
The practical advice splits along the platform-fit line. Below the DSO threshold, the right benchmark is what private buyers are paying for similar practices, not what DSOs are paying for platform deals. Quoting the upper band as a target sets sellers up for a long, frustrating market.
Above the platform threshold the question changes. The biggest swing in what the practice actually clears is whether the seller runs a competitive marketed process or accepts the first DSO offer. TUSK data show the marketed-process premium adds to the DSO-private spread rather than replacing it [2].
Both cases live inside the same valuation logic. The four-path transition framework walks owners through the decision tree before any offer is on the table.
Frequently Asked Questions#
Do DSOs always pay more than private buyers? No. The premium is conditional on fit. Practices below roughly $1.2M in collections, heavily owner-dependent practices, rural locations, and specialty practices outside the buyer's clinical mix often see the premium compress or disappear [1]. The headline 30 to 50 percent figure applies to platform-fit candidates, not the universe of all transitions.
What EBITDA multiple should a solo GP practice expect from a private buyer in 2026? Mid-range expectations sit at 4.5 to 5.5 times EBITDA based on broker aggregate data covering completed transactions [1][3]. Outliers exist on both sides; practice quality, location, hygiene mix, and lease economics all move the realized multiple within and occasionally outside that band.
What multiple do mid-size group practices clear? Mid-size groups clear 6 to 7 times EBITDA; platform-fit candidates reach 7.5 to 8 times when geography and clinical mix align with an active acquirer [1][2]. The step-up tracks platform-eligibility thresholds rather than gradual scaling.
Why do DSO multiples vary so widely (5 to 12 times)? The variation is definitional. Stand-alone solo deals sold to small DSOs cluster near the bottom. Practices that fit cleanly into an existing DSO platform occupy the middle band. Large multi-location strategic acquisitions and platform-level deals between investors sit at the top [1][5]. Quoting a single DSO multiple obscures the tier structure.
Are DSO offers fair? Fair is the wrong question. DSO offers are competitive inside the structure they're priced from: how the buyer borrows money, the resale-price math the buyer is targeting, and how well the practice fits an existing platform. The owner's negotiating room comes from running a competitive process, not from arguing with the buyer's pricing logic. Without a marketed process, sellers often leave premium on the table even when the headline DSO multiple looks fine [2].
Limitations#
The multiples reported here come from broker and DSO disclosures, both of which carry selection bias. Only deals that actually close enter the data; failed and withdrawn deals are missing entirely. Reported ranges therefore tend to overstate where the median deal lands.
The word DSO itself shifts the range. Formal DSOs, invisible DSOs (IDSOs), and partnership structures use different earnings definitions, different rules for what counts as working capital, and different requirements for how much of the sale price the seller leaves behind as ownership in the new platform. Two deals priced at the same multiple can produce very different cash to the seller [1][2].
What This Means For Your Practice
The 30 to 50 percent DSO premium documented here is conditional on platform fit, not automatic. Whether a particular practice qualifies is decided by practice-specific variables: collections threshold relative to the DSO's platform criteria, owner-versus-associate production split, geography, specialty mix, and the buyer-side disqualifiers (sub-platform-threshold collections, owner-dependence, rural location, specialty mismatch) that eliminate the premium entirely. The aggregate premium does not survive any of these disqualifiers.
Sources#
[1] FOCUS Investment Banking, "2026 Dental Industry Update," 2026. [2] TUSK Practice Sales, "Q2 2026 Dental Market Report" and "2025 Market Review & 2026 Outlook," 2025-2026. [3] McLerran & Associates broker aggregate transaction data, 2024-2026. [4] ADA Health Policy Institute, "Supply of Dentists" series, 2024-2025. [5] Private Practice Research, "The State of Dental Practice Values: 2026 Baseline Report," PPR Edition PPR-BASELINE-2026-V1.
Frequently Asked Questions
How much more do DSOs pay than private buyers for the same dental practice?
Dental support organizations pay a 30 to 50 percent premium over private individual-buyer transactions on a multiple basis when the practice meets platform-fit criteria. The premium is conditional, not automatic. Sub-platform-threshold collections, owner-dependence above 90 percent of production, rural location, and specialty mismatch each eliminate the premium entirely. The aggregate observation comes from broker-published multiples at FOCUS Investment Banking, TUSK Practice Sales, and McLerran & Associates triangulated against ADA Health Policy Institute aggregate data.
What practice characteristics qualify for the DSO premium?
Qualifying practices typically have collections at or above the platform's threshold (commonly 1.5 million dollars and up for many DSO platforms), owner-versus-associate production split that demonstrates replaceability of the selling doctor, urban or suburban geography aligned with the platform's network, and specialty mix the platform values. Practices outside any of those criteria see the premium compress or vanish.
Why does the DSO premium disappear for some practices?
The premium reflects what scale, replaceability, and operational systems are worth to a private-equity-backed acquirer. Practices that lack any of those structural features are not platform candidates and therefore do not earn the premium even if they are profitable. The aggregate gap and the practice-specific outcome are different questions; aggregate research cannot resolve which side of the disqualifier line a particular practice sits on.