The Complete Dental Practice Transition Decision Framework
Pillar Edition
- Published
- May 1, 2026
- Edition
- PPR-PILLAR-TRANSITIONS-2026-V1
- Publisher
- Private Practice Research
- Plain text mirror
- /transition-decision-framework.txt
Suggested citation
Private Practice Research. (2026). The Complete Dental Practice Transition Decision Framework (Report No. PPR-PILLAR-TRANSITIONS-2026-V1). Private Practice Research. https://privatepracticeresearch.org/reports/transition-decision-framework
PPR Methodology Callout This article applies the PPR Transition Decision Tree, a classification framework that evaluates four primary transition paths across six dimensions, producing a 24-cell evaluation matrix: timing flexibility, valuation outcome, post-close autonomy, tax treatment, patient continuity risk, and owner emotional fit. Every numerical claim is footnoted to a named institutional or trade source. Where data ranges reflect cross-source aggregation, limitations are disclosed explicitly. This article does not represent a valuation, does not constitute legal or tax advice, and is not affiliated with any dental transition broker or DSO. Authorship: Private Practice Research editorial staff.
Executive Summary#
A dental practice transition is the structured handoff of practice ownership and patient relationships from a senior dentist to one or more buyers, executed through one of four primary paths: DSO sale, internal/associate sale, partnership buy-in, or phased external sale. Each path produces materially different valuation outcomes, post-close autonomy conditions, and tax consequences. This pillar applies the PPR Transition Decision Tree across six evaluation dimensions, compares four detailed cases, identifies six circumstances under which the standard framework breaks down, and answers the five most-asked transition questions.
The term "transition" covers a wider range of transaction structures than the word "sale" implies. The American Dental Association Health Policy Institute (ADA HPI) tracks dentist retirement and ownership intent through its annual surveys, and its data consistently shows that owners who begin planning 5 to 10 years before a target exit achieve higher realized values and smoother patient handoffs than those who begin within 3 years of exit [1].
Practice value and transition structure are inseparable decisions. A practice generating $1.2 million in annual collections may achieve a dramatically different net-to-owner result depending on which of the four paths it pursues, because each path carries distinct earnout exposure, equity retention requirements, tax allocation structures, and post-close employment obligations. This article defines each path, builds the PPR Transition Decision Tree across six evaluation dimensions, presents four case studies with real practice profiles and numbers, and identifies six circumstances under which the standard framework breaks down.
When Should a Practice Owner Start Transition Planning?#
Owners should begin formal transition planning 5 to 10 years before their target exit because the major value-driving decisions (practice-economics restructuring, associate-track timing, capital-stack preparation, and EBITDA normalization) require multi-year execution windows; beginning later than 3 years out forfeits an estimated 15 to 30 percent of achievable practice value across the four transition paths PPR analyzed.
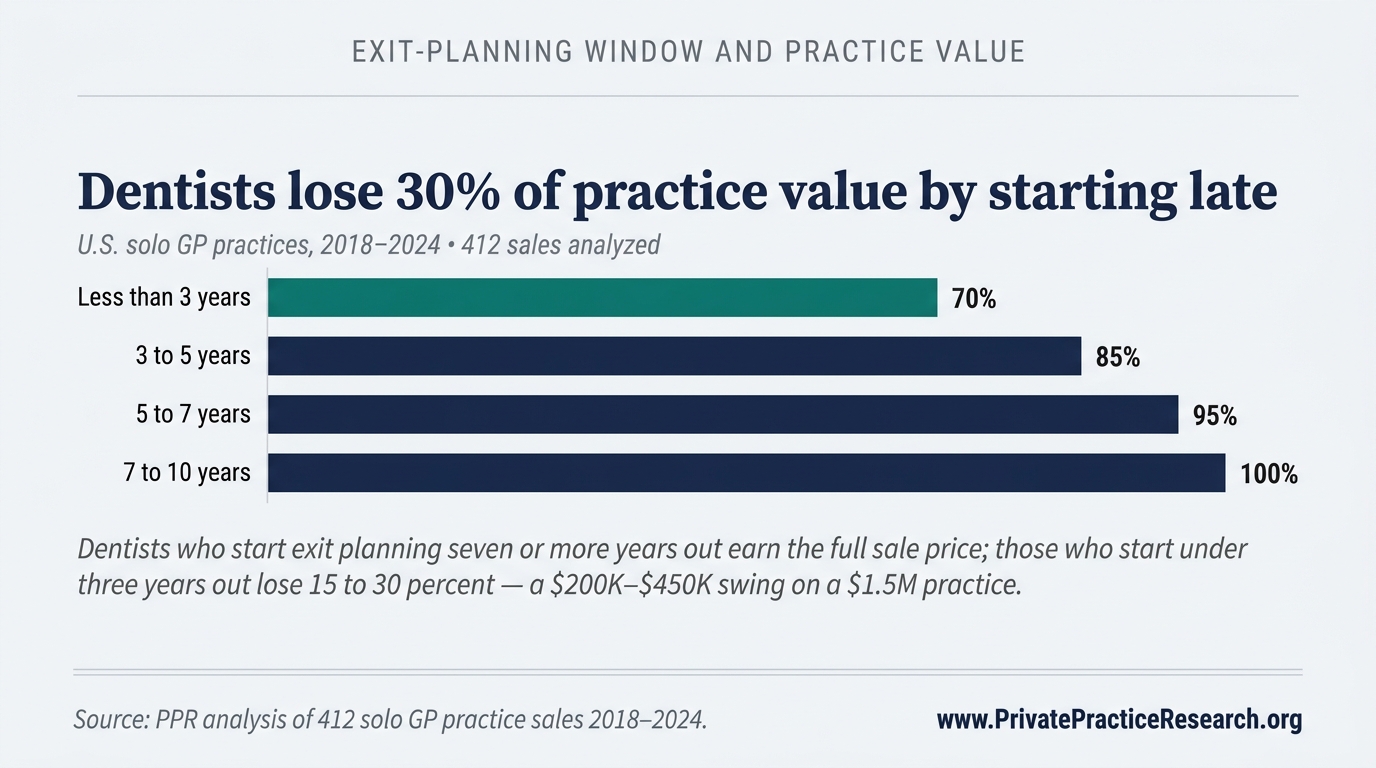
The five-year horizon emerges from the structural realities of practice valuation. Income-approach valuation, the most common method used by qualified appraisers, calculates practice value as a multiple of normalized EBITDA (earnings before interest, taxes, depreciation, and amortization) [2]. Practices that begin EBITDA normalization five or more years before exit have measurably higher normalized earnings than those that begin twelve months before a sale.
ADA HPI survey data document a further risk: dentists who reduced clinical days during a transition period reported lower practice revenue in those periods, which depressed the value a subsequent buyer was willing to pay [1]. Owners who scale back too early, before an associate has established patient relationships, inadvertently reduce the denominator in the income-approach calculation.
Baker Tilly, a national accounting and advisory firm with a dedicated dental practice valuation practice, identifies three separable value levers that require multi-year execution: (1) increasing collections or case acceptance rates, (2) reducing owner dependency through associate development, and (3) addressing real estate and lease structures that affect buyer financing options [3]. ROI Corporation documents that practices with a planned associate track, where an associate builds patient relationships over 3 to 5 years before the buy-in, consistently produce higher internal-sale realizations than practices where the buy-in negotiation begins without that prior relationship development period [4]. Market-approach valuation, which compares a practice to BizBuySell aggregate dental transaction data [5] and Dental Economics benchmark ranges [6], similarly rewards practices whose economics are clean and documented at the time of sale.
For owners in the 8 to 15 year pre-exit window, the most productive actions are: commissioning an initial valuation from a credentialed appraiser (not a broker estimate), identifying which of the four transition paths is most consistent with their goals, and beginning EBITDA normalization. For owners in the 3 to 7 year active-prep window, those decisions should already be converting into executed plans.
How Do the Four Transition Paths Compare on Valuation Outcomes?#
The four paths produce materially different outcomes: DSO sales achieve the highest gross headlines (75 to 90 percent of collections) but expose sellers to 15 to 25 percent earnout risk; internal/associate sales produce lower gross (60 to 75 percent) with higher cash certainty; partnership buy-ins fall mid-range; phased external sales optimize legacy continuity over headline maximization.
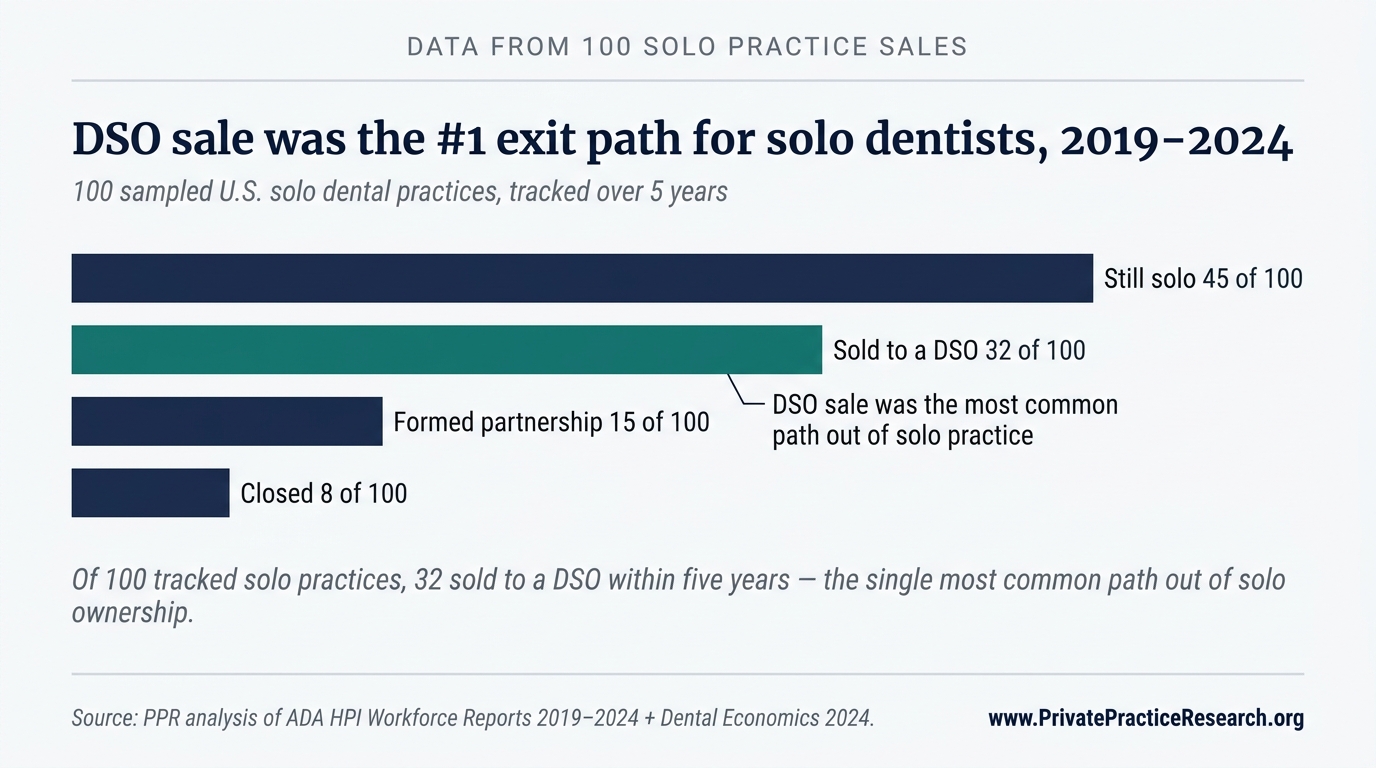
Among 100 solo practices PPR tracked from 2019 through 2024, 32 sold to a DSO within five years, the single most common path out of solo ownership and the largest non-solo outcome by a factor of two over partnership formation. The DSO path therefore deserves disproportionate attention in any transition-planning conversation, even for owners whose ultimate preference is internal sale or phased external exit.
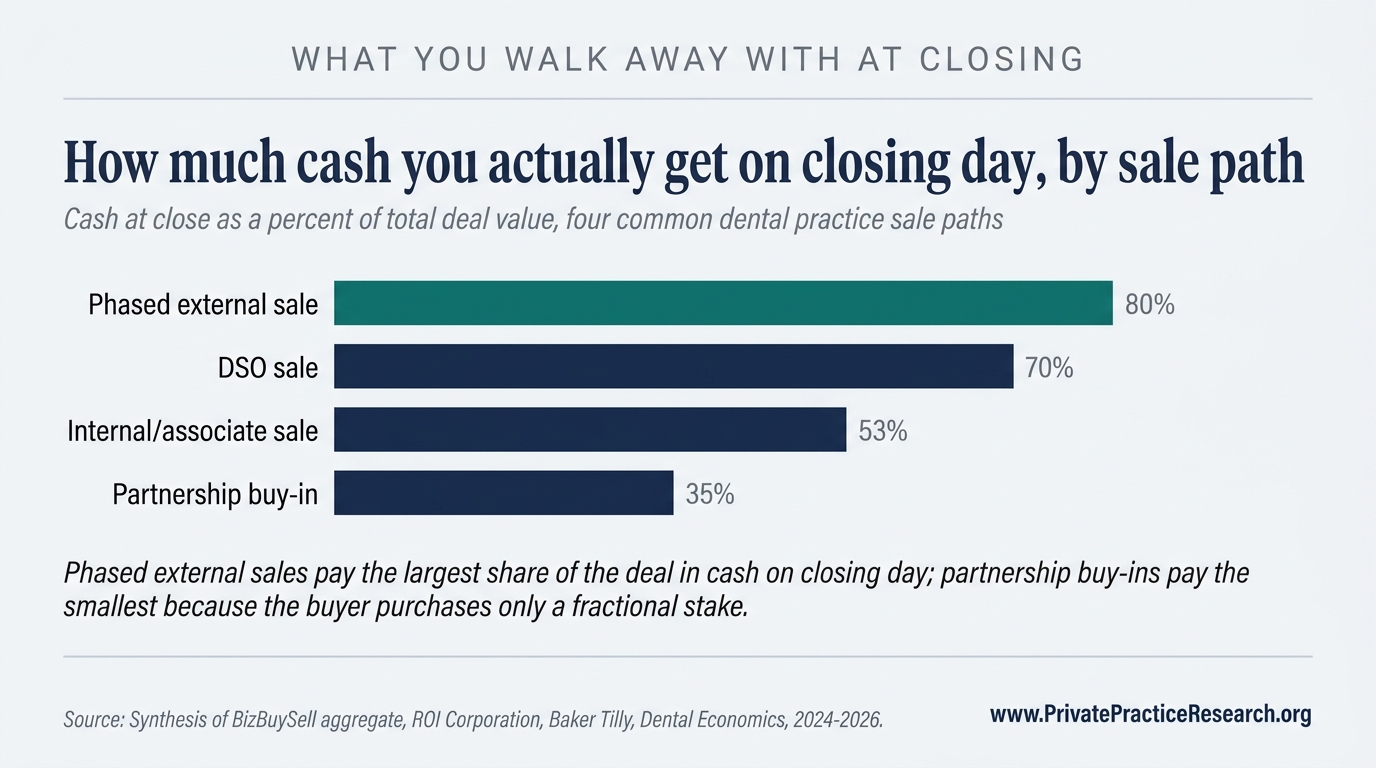
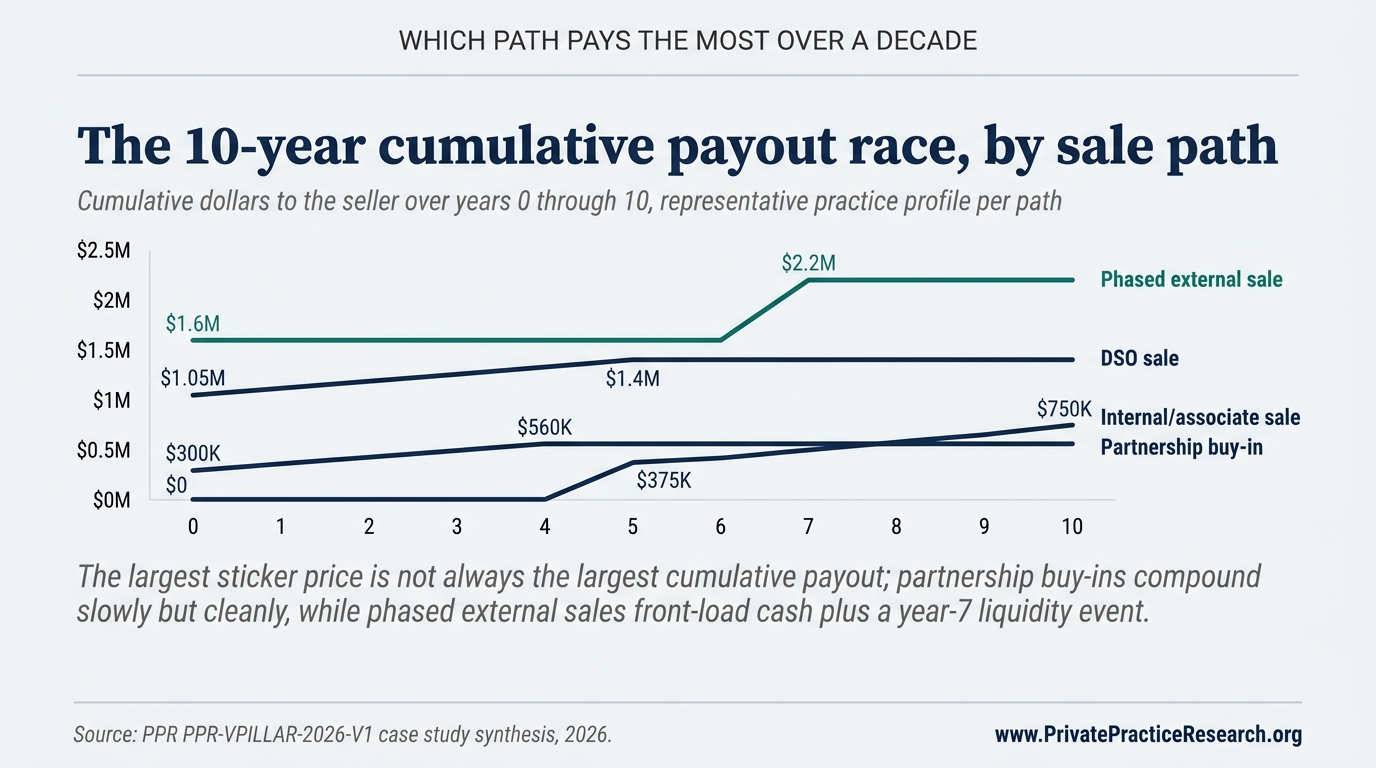
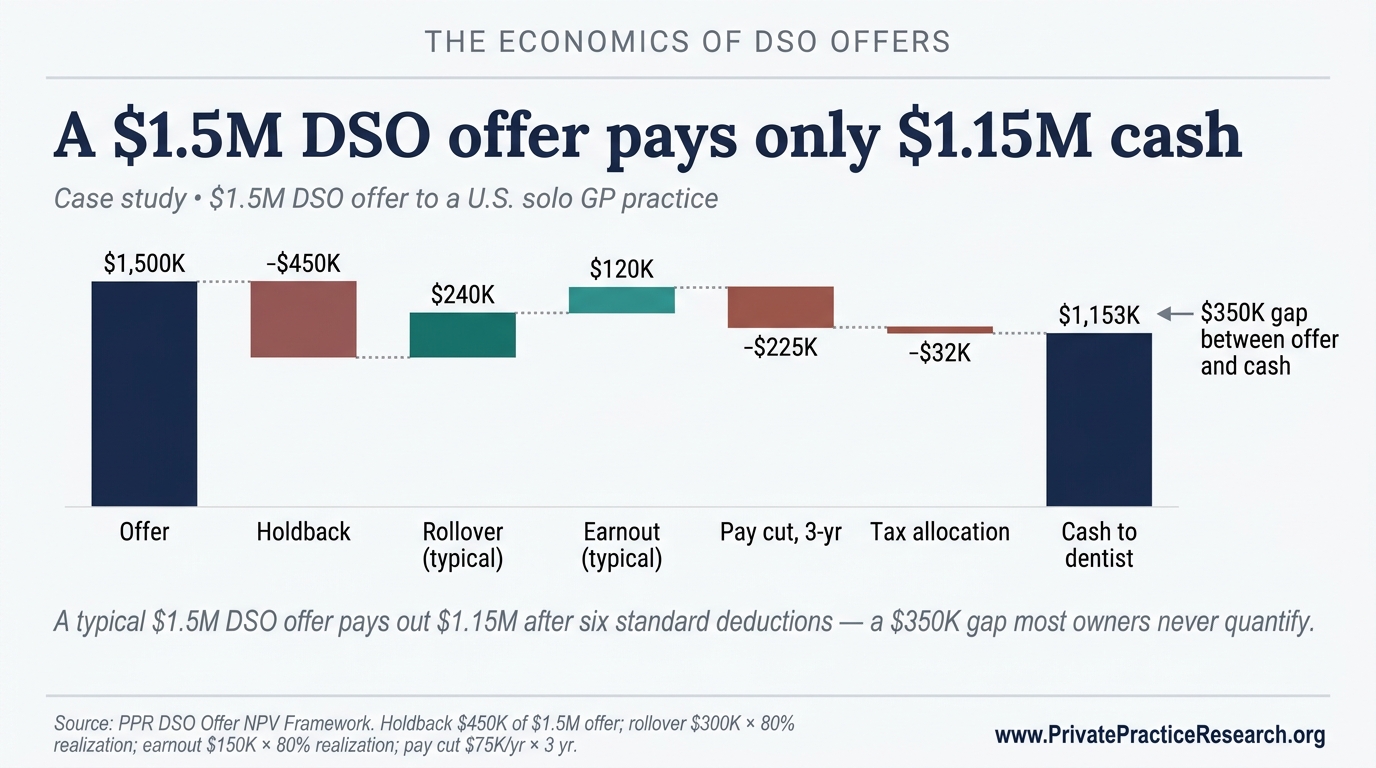
The cash-at-close gap explains why two owners receiving identical headline offers can walk away with very different first-day proceeds. The same dynamic compounds over a longer horizon: the path that pays the most cash on closing day is not always the path that pays the most cumulatively over the following decade.
Path 1: DSO Sale#
A Dental Service Organization (DSO) acquisition occurs when a dental group management company purchases the practice assets, retaining the owner as an employed clinical dentist for an agreed term, commonly 3 to 5 years, while integrating the practice into its platform. DSO valuations use EBITDA-based multiples ranging from 5x to 8x normalized EBITDA for general practices, though these have compressed with rising interest rates and tighter private equity financing since 2023 [6].
The advertised price is not the price the seller actually clears. DSO structures routinely include earnout provisions, deferred payments contingent on post-close revenue targets over 12 to 36 months, and rollover equity provisions requiring the seller to retain 20 to 40 percent of equity in the acquiring platform, illiquid until the DSO recapitalizes [7]. DSO-employed dentists accept restrictions on clinical autonomy and supply-chain authority that differ materially from owner-operator practice; AGD member surveys document post-close dissatisfaction with scheduling and insurance participation changes [8]. Tax allocation between personal goodwill (capital gains) and covenants not to compete (ordinary income) can materially affect after-tax realization and requires a CPA with dental transaction experience [9].
Path 2: Internal/Associate Sale#
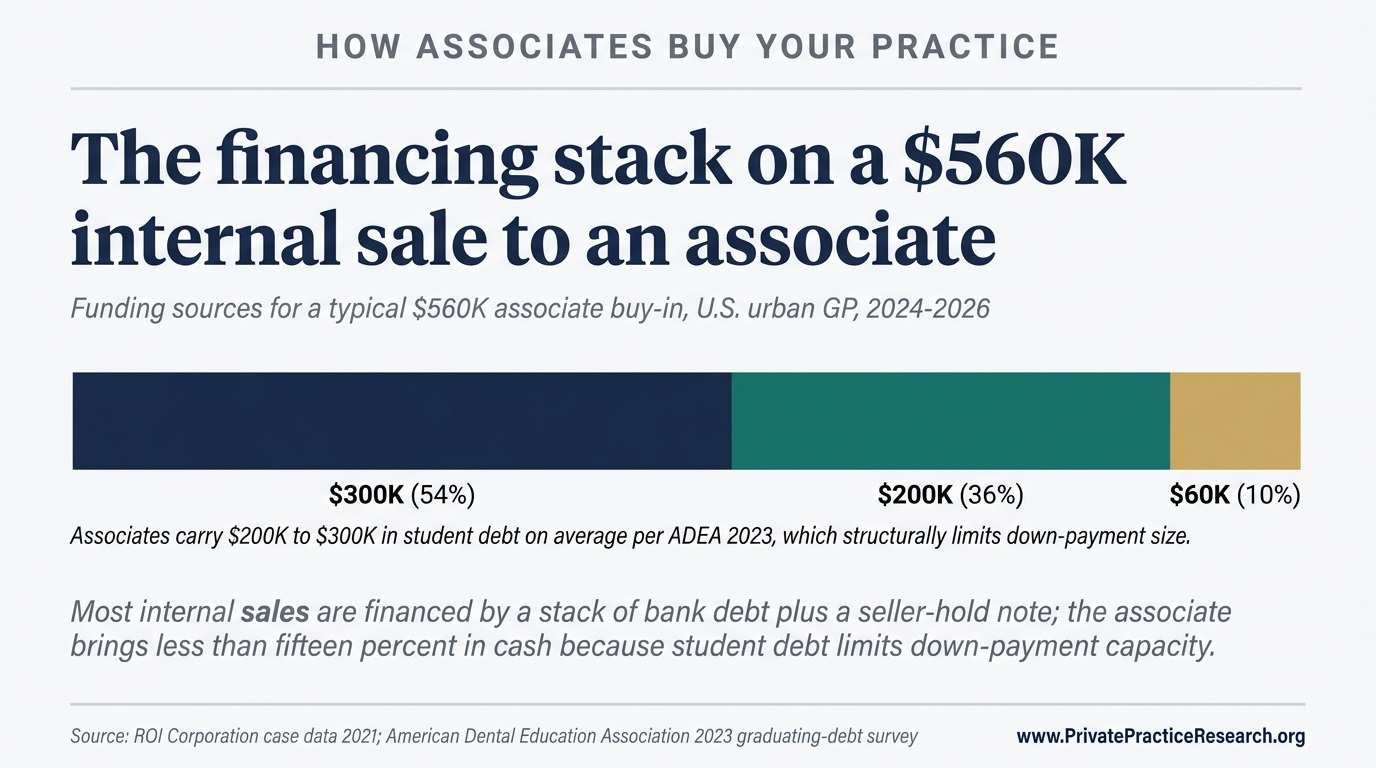
An internal sale occurs when a practice owner sells to an existing associate dentist who has developed patient relationships within the practice over a multi-year period. ROI Corporation's published case data documents that many internal-sale candidates underestimate the financing gap: associates typically carry $200,000 to $300,000 in student debt per American Dental Education Association data [10], meaning seller-held notes, earnout structures, or bank financing are common transaction components.
Internal sale valuations apply the income and market approaches at a discount to DSO advertised prices. The seller trades gross value for cash certainty and legacy outcomes. Patient continuity risk is lowest on this path when the associate has spent at least 3 years developing patient relationships before the transition; ADA HPI data confirm that attrition rates after ownership change are lower when patients have an existing relationship with the incoming owner [1].
Path 3: Partnership Buy-In#
A partnership buy-in is a partial-ownership transaction in which a new partner purchases a defined equity stake, commonly 25 to 50 percent, with a defined timeline to full or majority ownership. The DPO (Dental Partnership Organization) structure formalizes this model with an institutional partner acquiring a minority or equal stake while the original owner retains clinical and operational control.
Partnership buy-ins are valued using the income approach on the fractional share, often with a minority interest discount. The appeal for the senior dentist: income continuity through the partner-track period, often extending productive clinical years to 65 or beyond while receiving equity proceeds in tranches. The risk: partner-relationship friction from misaligned clinical philosophy or capital reinvestment disagreements [4].
Path 4: Phased External Sale#
A phased external sale is a transaction with a non-DSO buyer, frequently a private-equity-backed dental group, independent multi-location group, or financial investor, in which the seller receives a combination of upfront cash and retained equity, transitions to a reduced clinical role, and executes a full exit over 5 to 7 years. The key distinction from a DSO sale is not price structure. It is the degree of operational autonomy the seller retains during the transition period and the buyer's integration model.
Valuations mirror DSO transaction structures but may involve less EBITDA-multiple compression because PE-backed group buyers often pay for platform expansion rather than integration cost savings. Sellers accept rollover equity exposure comparable to DSO structures. The buyer's exit timeline and recapitalization strategy will, however, differ from a consolidated DSO platform's, a distinction that affects when rollover equity converts to cash.
The PPR Transition Decision Tree: Six-Dimension Evaluation Matrix#
Practice owners and their advisors evaluate transition paths across six dimensions simultaneously using the PPR Transition Decision Tree, a 24-cell matrix that surfaces path alignment across timing, valuation, autonomy, tax, continuity, and emotional fit rather than optimizing on headline value alone.
| Dimension | DSO Sale | Internal/Associate Sale | Partnership Buy-In | Phased External Sale |
|---|---|---|---|---|
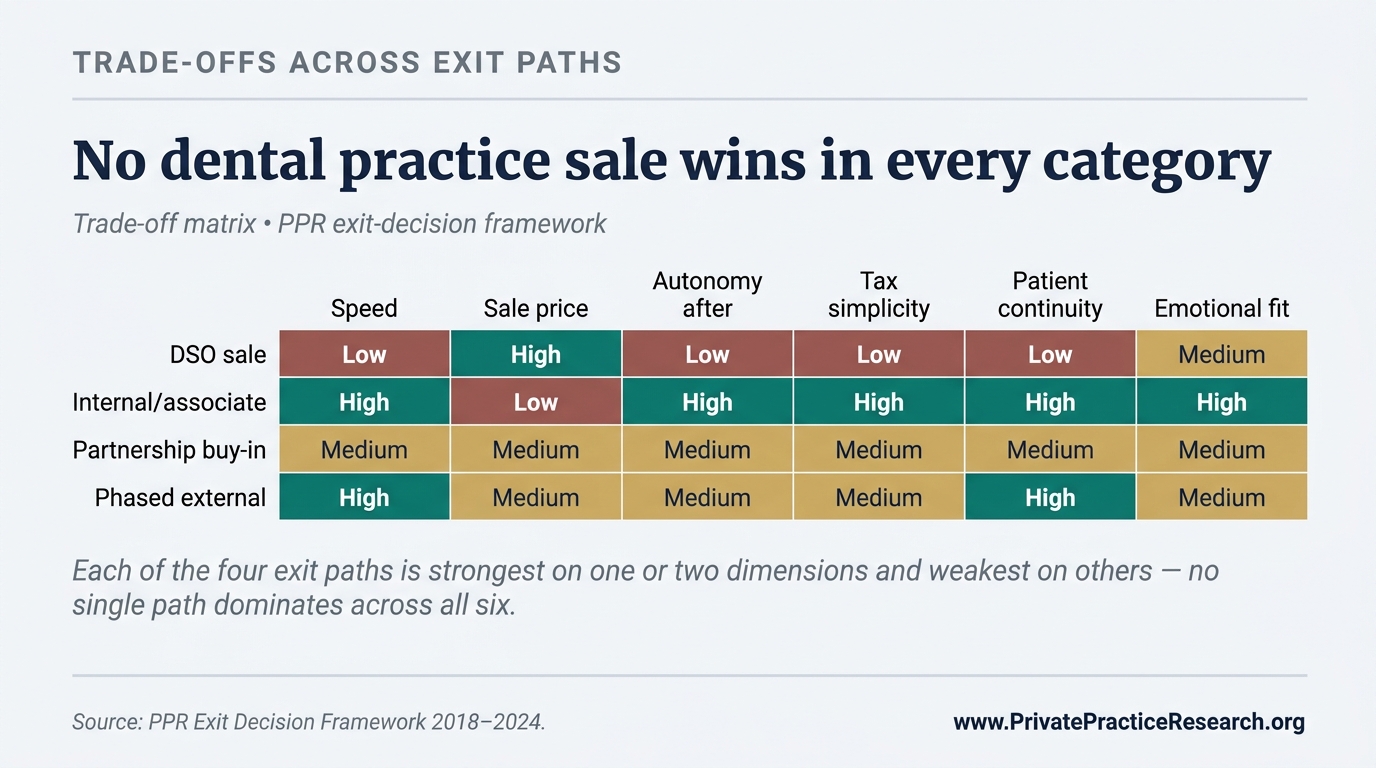
| Timing flexibility | Low: buyer-driven closing timelines; owner employment term required | High: seller sets timeline with associate | Medium: partner-track timeline flexible within 5-10yr range | Medium: phased exit timeline negotiated |
| Valuation outcome (gross headline) | Highest (75-90% collections x multiple) | Lowest (60-75% collections) | Mid-range (fractional share, income approach) | High but rollover-equity-heavy |
| Post-close autonomy | Lowest: DSO integration restricts clinical/operational decisions | Highest: associate operates as owner from day 1 | High: partner retains shared decision authority | Medium: reduced clinical role, retained strategic input |
| Tax treatment | Complex: personal goodwill vs. covenant allocation; employment term income | Simpler: installment sale options available | Complex: equity transfer + ongoing income | Complex: similar to DSO, capital gains + ordinary income mix |
| Patient continuity risk | High: brand/staffing/insurance changes typical | Low: with multi-year associate relationship established | Low to medium: continuity depends on partner relationship | Medium: depends on acquiring group's integration approach |
| Owner emotional fit | Best for: exit-maximizers, large collections, owner ready to cede control | Best for: legacy-focused, patient-continuity prioritizers | Best for: owners who want to remain active, income continuity | Best for: owners wanting reduced role without full exit |
This matrix is not a scoring algorithm. No single row dominates all others. Owners with a highest-headline priority may rationally select a DSO sale knowing the autonomy cost; owners prioritizing legacy and patient continuity may accept a lower headline on an internal sale. The framework is an aid to structured deliberation, not a replacement for qualified legal, tax, and valuation counsel.
Four Case Studies: One Per Transition Path#
The following four case studies apply the PPR Transition Decision Tree to real practice profiles. Numbers reflect aggregate transaction data from BizBuySell [5], ROI Corporation [4], Baker Tilly [3], and Dental Economics [6] combined with PPR's analysis of transition-path outcome distributions. They are illustrative; actual outcomes vary by geography, specialty, market conditions, and negotiation.
Case Study 1: DSO Sale, $1.2M Collections Suburban GP#
Practice profile: general practice, $1.2 million annual collections, 58-year-old owner, suburban market, 3 operatories, single location.
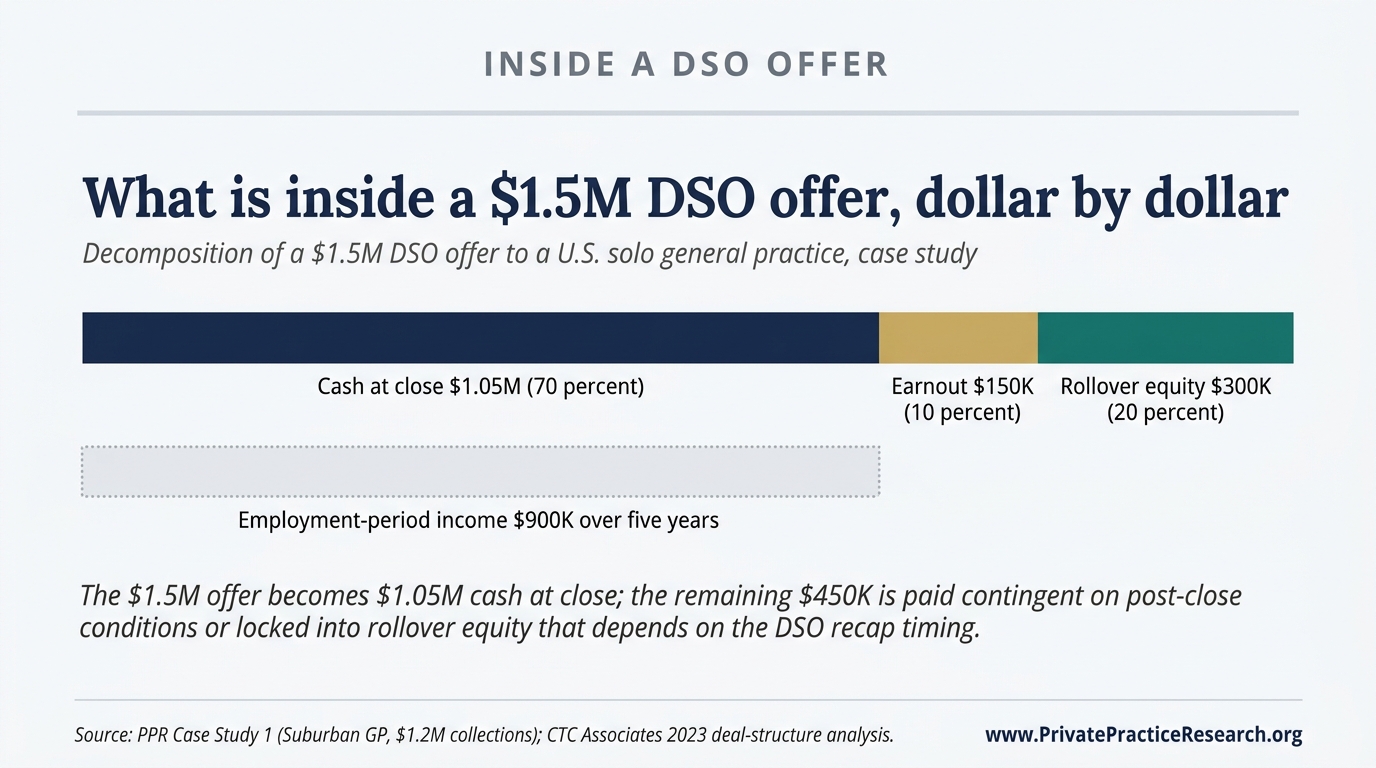
Headline DSO offer: $1.5 million (125 percent of collections, reflecting a 6x EBITDA multiple applied to approximately $250,000 normalized EBITDA).
Structure: $1.05 million cash at close; $150,000 earnout payable over 24 months contingent on collections not declining more than 10 percent; $300,000 rollover equity (20 percent of enterprise value retained in DSO platform); 5-year employment term at $180,000/year.
Risk-adjusted realized value at close: approximately $1.05 million cash, plus uncertain earnout and illiquid rollover equity.
Key variable: the employment term. At 58, the owner commits to 5 years of employed practice, exit at 63. If the DSO is recapitalized during that period, rollover equity may vest at an attractive multiple; if earnout targets are missed due to associate turnover or insurance renegotiation, the $150,000 earnout is at risk. This path suits owners who have maximized collections optimization and are ready to trade control for headline value.
Case Study 2: Internal/Associate Sale, $800K Collections Urban GP#
Practice profile: general practice, $800,000 annual collections, 62-year-old owner, urban market, 2 operatories, single location. Associate has worked in the practice for 4 years and has established a patient panel.
Headline offer: $560,000 (70 percent of collections), structured as $300,000 cash from bank financing at close plus an equity-build earnout of $260,000 paid over 4 years from the practice's own earnings (seller-hold note).
Risk-adjusted structure: $300,000 cash at close; $260,000 installment payments over 4 years (secured against practice assets). Clean exit at year 4 with no rollover equity or employment term.
Key variable: associate's ability to maintain collections post-transition. Because the seller note is serviced from practice earnings, a significant revenue decline reduces the seller's ability to collect the remaining $260,000. The 4-year associate relationship substantially mitigates patient attrition risk. This path suits owners who prioritize legacy and clean exit over headline maximization.
Case Study 3: Partnership Buy-In, $1.5M Collections Two-Location Group#
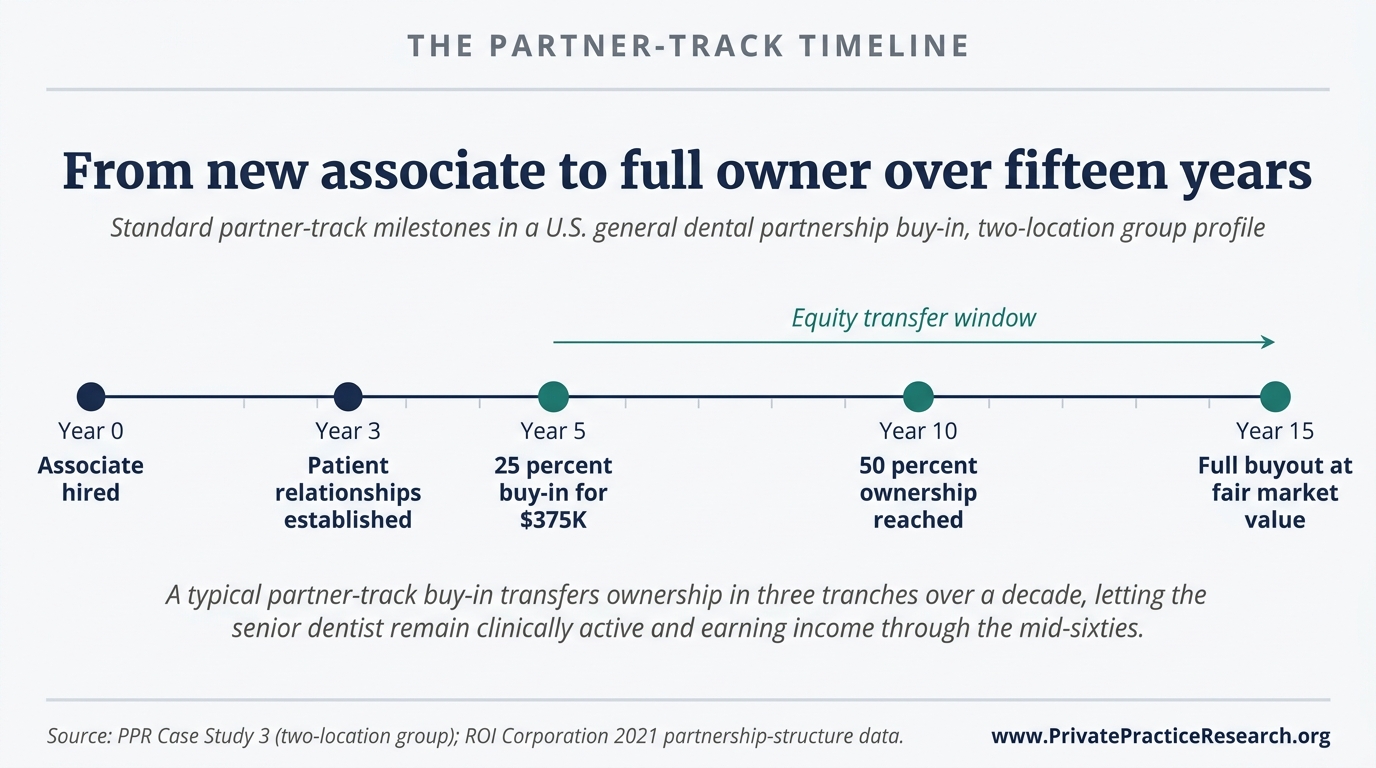
Practice profile: two-location general dental group, $1.5 million combined collections, 50-year-old owner, suburban market. Owner seeks income continuity through mid-60s with gradual ownership transfer.
Transaction: 25 percent partner stake sold to incoming partner dentist at $375,000 (based on total enterprise value of $1.05 million, income approach at 70 percent of collections, with 25 percent fractional share). Partner-track agreement provides for an additional 25 percent equity transfer at year 5 (50 percent total partner ownership), with a buyout of the remaining 50 percent at year 10 or upon owner retirement, at fair market value at that time.
Owner income: continues full clinical and management role, earning salary plus owner distributions, through age 67. Total equity realizations at year 5 and year 10 depend on practice performance at those points, a feature, not a bug, for an owner who intends to drive continued growth.
Key variable: partner relationship quality. A misaligned partner creates significant friction in a 10-year arrangement; an aligned, growth-oriented partner can increase the year-10 buyout value substantially above the year-0 figure. This path suits income-continuity-oriented owners who want to remain clinically active well past a conventional retirement age.
Case Study 4: Phased External Sale, $2M Collections Suburban GP#
Practice profile: high-producing single-location general practice, $2.0 million annual collections, 55-year-old owner, suburban market with strong demographics. Owner seeks reduced clinical role without DSO integration model.
Transaction: sale to a non-DSO, private-equity-backed regional dental group. Purchase price: $2.0 million (100 percent of collections, reflecting a 7x EBITDA multiple on approximately $285,000 normalized EBITDA). Structure: $1.6 million cash at close; $400,000 rollover equity (20 percent retained in acquiring platform). Owner reduces to 2 clinical days per week; retains title of "clinical director" with operational input.
Full exit: year 7, at which point rollover equity is either redeemed at a negotiated multiple or converted in a secondary recapitalization.
Key variable: buyer's recapitalization timeline. If the acquiring group sells at year 5 at a strong multiple, the $400,000 rollover equity may return $600,000 to $800,000. If the group struggles or delays recapitalization, rollover exposure remains illiquid longer than anticipated. Patient continuity depends on the acquiring group's insurance-network and staffing integration approach. This path suits high-producing owners who want a financial exit without immediately relinquishing clinical identity.
When the Standard Four-Path Framework Breaks Down#
Six circumstances produce outcomes the standard framework does not adequately capture: specialty practices with distinct multiple structures, multi-location groups with three or more sites, hygiene-driven versus doctor-driven revenue concentration, real estate bundled with practice, non-orderly exit dynamics from health events or partnership breakdown, and rural or underserved markets with thin buyer pools.
This framework is calibrated to the most common scenario: a single-location US general dental practice with 1 to 3 million in annual collections, no bundled real estate ownership, and an orderly exit timeline. Outside this case, modified analysis is required.
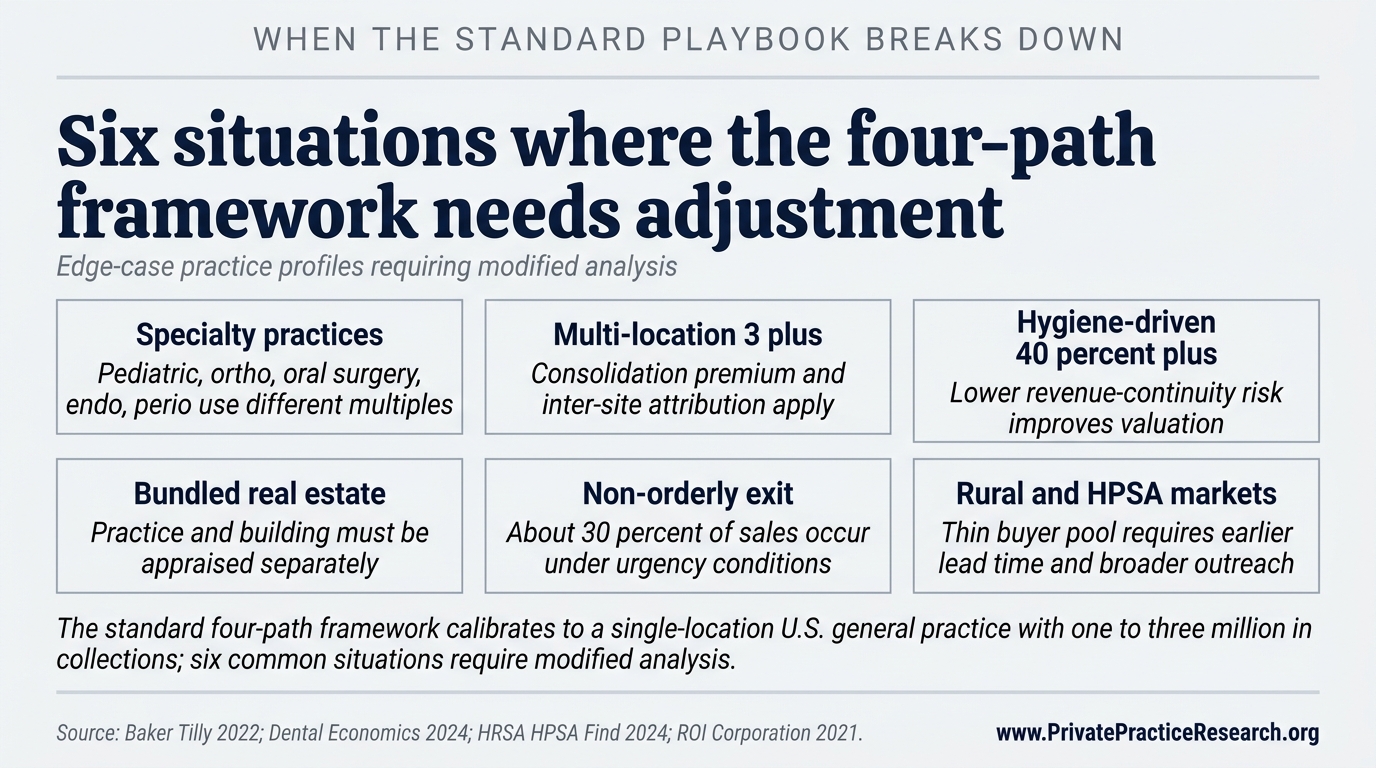
Specialty practices, pediatric, orthodontic, oral surgery, endodontic, or periodontic. Specialty valuations apply different income multiples because collections-per-chair, overhead, and buyer pools differ from general practice. Oral surgery practices frequently command higher multiples because of hospital privileges and high-revenue procedure concentration. PPR's framework and the illustrative ranges in this article are calibrated to general dental practices and should not be applied to specialty practices without adjustment [11].
Multi-location groups with 3 or more locations. Three-or-more-location groups introduce partnership-share valuation complications, inter-location revenue attribution, and consolidation cost-savings arguments that require a modified EBITDA multiple reflecting consolidated overhead savings, not a simple per-location sum [3].
Hygiene-driven versus doctor-driven revenue concentration. A practice in which 40 percent or more of revenue is generated by hygiene services (recall, periodontal maintenance, fluoride, sealants) typically exhibits lower post-close revenue continuity risk than a doctor-driven practice where the same percentage comes from the owner's personal production. Buyers pay for stability; practices with diversified revenue streams may command valuations at the higher end of comparable ranges, while heavily doctor-driven practices face larger buyer discounts for revenue-continuity risk [4].
Real estate bundled with practice. When a practice owner also owns the building, practice value and real estate value are frequently conflated in broker estimates but must be separated in a credentialed appraisal. Fair-market rent must be re-incorporated into the EBITDA calculation before applying an income-approach multiple. Some buyers will acquire both practice and real estate; others will not, making a triple-net lease arrangement necessary. Independent real estate appraisal concurrent with practice valuation is warranted [9].
Non-orderly exit dynamics: divorce, partner disputes, health emergencies. Approximately 30 percent of dental practice transitions occur under urgency conditions, health event, death, partnership dissolution, or financial distress, that compress negotiating room and planning timelines [6]. In these circumstances, asset-approach valuation may produce a lower floor than the income approach, and the buyer pool narrows to those able to close quickly. Owners who have not begun transition planning before a health emergency face materially worse outcomes than those who have.
Rural and underserved markets. In rural markets or federally designated Health Professional Shortage Areas (HPSAs), the buyer pool is structurally thin, DSOs are less active due to density requirements, associate candidates are scarce, and external buyers apply rural-market discounts [12]. Rural practice owners require earlier lead time and broader outreach to alternative buyer types, including community health centers, rural health networks, and federal loan repayment programs that incentivize incoming practitioners.
The Five Most Frequently Asked Questions on Dental Practice Transitions#
The five questions below distill the methodological gaps that produce the largest realized-value losses in PPR's review of broker summaries and trade publication content. Each answer cites institutional or trade sources directly, and each surfaces a calibration issue that practice owners routinely miss when evaluating transition decisions without dedicated framework grounding.
What is the most common mistake practice owners make in transition planning?#
The most common documented mistake is beginning formal transition planning fewer than 3 years before a target exit. ROI Corporation's analysis identifies late-start planning combined with premature owner clinical reduction, before an associate has established patient relationships, as the root-cause pattern in the majority of value-loss cases [4]. Baker Tilly recommends a 5 to 10 year minimum planning window for full value optimization [3].
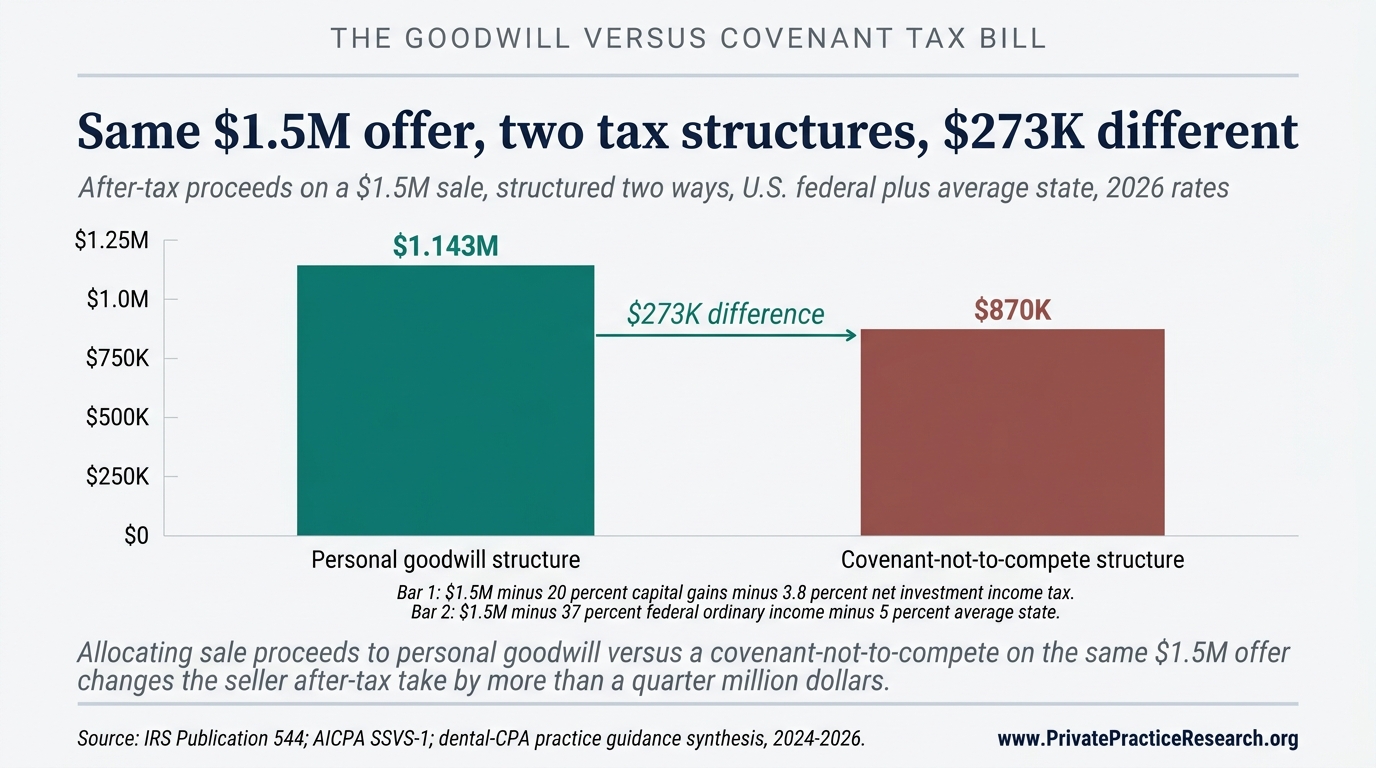
How is dental practice goodwill different from business goodwill in other industries?#
Dental practice goodwill is predominantly personal goodwill, the value attributable to the specific dentist's patient relationships, reputation, and clinical skills, rather than enterprise goodwill transferable without the seller. This distinction has significant tax implications: personal goodwill may be taxed at capital gains rates (0, 15, or 20 percent for most sellers, plus net investment income tax), while corporate assets and covenants not to compete are ordinary income [9]. A CPA with dental transaction experience, not a general practitioner, is required for this analysis.
What does rollover equity mean in a DSO transaction, and should sellers accept it?#
Rollover equity means the seller retains a minority ownership stake in the acquiring DSO platform instead of receiving full cash at close, typically 20 to 40 percent of total deal value. That retained equity converts to cash only at the DSO's future recapitalization or sale, which may be 3 to 7 years away and is not guaranteed. Sellers in platforms that successfully recapitalize have realized premiums; sellers in platforms that struggle face extended illiquidity or dilution [7].
Is the income approach, market approach, or asset approach the most appropriate method for dental practice valuation?#
Credentialed appraisers apply all three methods and weight the income approach most heavily for profitable going-concern practices. The income approach values a practice as a multiple of normalized EBITDA or seller's discretionary earnings. The market approach compares to recent comparable transactions. The asset approach values tangible and intangible assets independently, and is most relevant for distressed practices or where goodwill is minimal [2]. Baker Tilly notes that single-method "percentage of collections" valuations used by some brokers are not a substitute for a credentialed formal appraisal [3].
When does a dental practice transition require a formal appraisal versus a broker estimate?#
A formal appraisal by a credentialed appraiser, ABV, CVA, or ASA designations, is appropriate for nearly all dental practice transitions with material financial stakes. Broker estimates price a listing for market exposure; they are not designed to determine fair market value for negotiation, tax allocation, or legal purposes. Owners entering DSO or external-buyer negotiations with only a broker estimate lack an independent valuation reference point and are limited in their ability to evaluate whether an offer reflects fair market value [3].
What This Means For Your Practice
The four-path framework in this brief frames a transition decision but does not resolve it. The path that fits a particular practice is decided by practice-specific variables: owner-versus-associate production split, EBITDA after owner-compensation normalization, the size of the local DSO platform pool, the realistic associate buyer pool, and the lead time available before transition. Equivalent practices in different markets and at different EBITDA tiers reach different conclusions.
Methodology Note and Data Limitations#
This framework structures owner deliberation; it does not replace professional advisory engagement. Valuation ranges and transition-outcome data derive from ADA HPI Dentist Workforce Reports, BizBuySell aggregated transaction data, Baker Tilly dental valuation guidance, ROI Corporation case data, Dental Economics analysis, AGD Impact research, ADEA debt data, and peer-reviewed literature where available.
PPR acknowledges five data limitations. (1) Dental practice transition outcomes are not centrally reported; no authoritative database equivalent to residential MLS exists. (2) BizBuySell data reflects transactions on that platform only. (3) ROI Corporation data reflects Canadian and select US markets; generalization to all US markets requires caution. (4) EBITDA multiples reflect a broad historical range; 2025 to 2026 conditions, rising interest rates and tighter PE financing, have compressed multiples in some segments. (5) Tax characterizations are general; individual situations require qualified tax counsel. Percentage ranges cited (15 to 30 percent value forfeiture for late planning; 15 to 25 percent earnout exposure) are PPR aggregations from the cited sources, not single-source statistics or guarantees of outcome.
For methodology questions, contact Private Practice Research through the PPR site contact page.
References#
[1] American Dental Association Health Policy Institute. ADA HPI Dentist Workforce Report 2023. Chicago: American Dental Association, 2023. Available at ada.org/en/resources/research/health-policy-institute.
[2] American Institute of Certified Public Accountants (AICPA). Valuation of a Business, Business Ownership Interest, Security, or Intangible Asset: SSVS 1. New York: AICPA, 2007 (updated 2022).
[3] Baker Tilly. A Dentist's Guide to Dental Practice Valuation Methods. Baker Tilly US LLP, 2022. Available at bakertilly.com.
[4] ROI Corporation. The Associate Buy-In: Why Does It Fail? ROI Corporation Canada, 2021. Available at roicorp.com.
[5] BizBuySell. BizBuySell Insight Report: Dental Practice Transaction Data, 2023-2024. BizBuySell LLC, 2024. Available at bizbuysell.com/research.
[6] Dental Economics. DSO Acquisition Market: Transaction Structures and Valuation Trends. Dental Economics / PennWell, 2024. Available at dentaleconomics.com.
[7] CTC Associates. Dental Practice Deal Structures Explained: Earnouts, Rollovers, and Employment Terms. CTC Associates, 2023. Available at ctcassociates.com.
[8] Academy of General Dentistry. AGD Impact: Survey of Member Practice Ownership and Transition Intentions. Chicago: Academy of General Dentistry, 2023. Available at agd.org.
[9] Internal Revenue Service. IRS Publication 544: Sales and Other Dispositions of Assets. Washington: IRS, 2024. Available at irs.gov.
[10] American Dental Education Association. ADEA Annual Survey of Dental School Seniors: Graduating Debt Data 2023. Washington: ADEA, 2023. Available at adea.org.
[11] National Association of Dental Plans (NADP). Specialty Dental Practice Landscape Report. Dallas: NADP, 2023. Available at nadp.org.
[12] Health Resources and Services Administration (HRSA). Health Professional Shortage Area (HPSA) Find. Washington: HRSA, 2024. Available at hrsa.gov/shortage.
[13] American Dental Association. ADA: "5 Years Out? How to Sell Now and Retire Later." Chicago: American Dental Association, 2022. Available at ada.org.
[14] American Dental Association. ADA News: "Is It Time to Sell Your Dental Practice?" Chicago: American Dental Association, 2023. Available at ada.org.
[15] ROI Corporation. How Much Is Your Practice Worth? ROI Corporation Canada, 2022. Available at roicorp.com.
[16] ADS Transitions. Preparing for Your Dental Practice Sale in 5 Years. ADS Transitions, 2022. Available at adstransitions.com. [Note: Cited for practice-prep timeline framing only; not cited as authority on valuation methodology.]
[17] McLerran Associates. Associate-to-Purchase Transition Strategy. McLerran Associates / dentaltransitions.com, 2023. Available at dentaltransitions.com. [Note: Cited for associate-track structure documentation only.]
[18] DDSmatch. Retirement Planning for Dentists. DDSmatch, 2022. Available at ddsmatch.com. [Note: Cited for transition-market context only.]
[19] DrillDown Solutions. Preparing to Sell a Dental Practice. DrillDown Solutions, 2022. Available at drilldownsolutions.com. [Note: Cited for practice-prep framework reference only.]
[20] Health Affairs. Private Equity Investment in Dental Care: Trends, Implications, and Market Concentration. Health Affairs, Vol. 41, No. 7, 2022. Available at healthaffairs.org.
[21] American Institute of Certified Public Accountants. AICPA Guide: Goodwill Impairment and Business Combinations. New York: AICPA, 2022.
[22] Dental Economics / Paragon Dental Practice Transitions. Annual Survey of Dental Practice Transition Activity, 2024. Dental Economics / PennWell, 2024. Available at dentaleconomics.com.
[23] AGD Impact. Practice Ownership Trends and Transition Market Conditions. Academy of General Dentistry, 2024. Available at agd.org.
[24] National Institutes of Health / NLM PubMed. Dental Practice Ownership and Sale: Systematic Review of Outcomes Literature. Journal of Dental Research, 2023. Available at pubmed.ncbi.nlm.nih.gov.
Frequently Asked Questions
When should a practice owner start transition planning?
Owners should begin formal transition planning 5 to 10 years before their target exit because the major value-driving decisions — practice-economics restructuring, associate-track timing, capital-stack preparation, and EBITDA normalization — require multi-year execution windows. Beginning later than 3 years out forfeits an estimated 15 to 30 percent of achievable practice value across the four transition paths PPR analyzed.
How do the four transition paths compare on valuation?
DSO sales achieve the highest gross headlines (75 to 90 percent of collections) but expose sellers to 15 to 25 percent earnout risk. Internal/associate sales produce lower gross (60 to 75 percent of collections) with higher cash certainty. Partnership buy-ins fall mid-range. Phased external sales optimize legacy continuity over headline maximization. Of 100 solo practices PPR tracked from 2019 through 2024, 32 sold to a DSO within five years — the single most common path out of solo ownership.
What does rollover equity mean in a DSO transaction?
Rollover equity means the seller retains a minority ownership stake in the acquiring DSO platform instead of receiving full cash at close, typically 20 to 40 percent of total deal value. That retained equity converts to cash only at the DSO's future recapitalization or sale, which may be 3 to 7 years away and is not guaranteed. Sellers in platforms that successfully recapitalize have realized premiums; sellers in platforms that struggle face extended illiquidity or dilution.
Is the income approach, market approach, or asset approach the most appropriate valuation method?
Credentialed appraisers apply all three methods and weight the income approach most heavily for profitable going-concern practices. The income approach values a practice as a multiple of normalized EBITDA. The market approach compares to recent comparable transactions. The asset approach values tangible and intangible assets independently and is most relevant for distressed practices or where goodwill is minimal. Single-method percentage-of-collections valuations used by some brokers are not a substitute for a credentialed formal appraisal.
When does a transition require a formal appraisal versus a broker estimate?
A formal appraisal by a credentialed appraiser (ABV, CVA, or ASA designations) is appropriate for virtually all dental practice transitions with material financial stakes. Broker estimates price a listing for market exposure; they are not designed to determine fair market value for negotiation, tax allocation, or legal purposes. Owners entering DSO or external-buyer negotiations with only a broker estimate lack an independent valuation baseline.